

Query data in SQL mode
In the Data query panel, switch to SQL mode, write and run the query, and use the returned result directly for chart mapping and rendering.
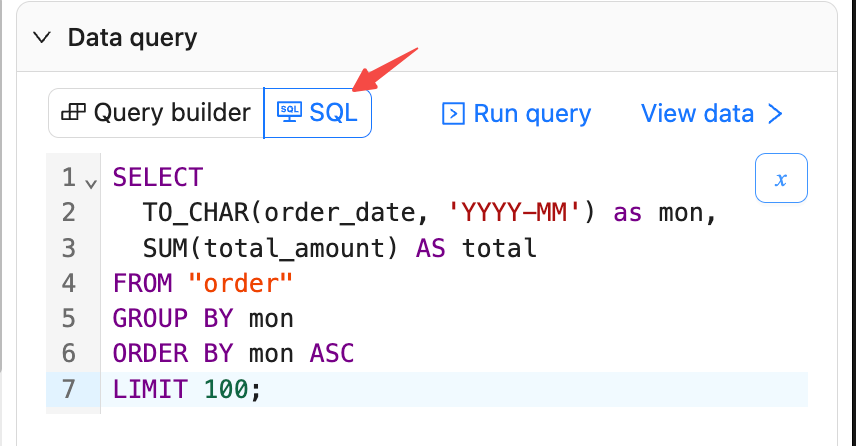
Write SQL statements
- In the Data query panel, choose SQL mode.
- Enter SQL and click Run query.
- Supports complex statements including multi‑table JOIN and VIEW.
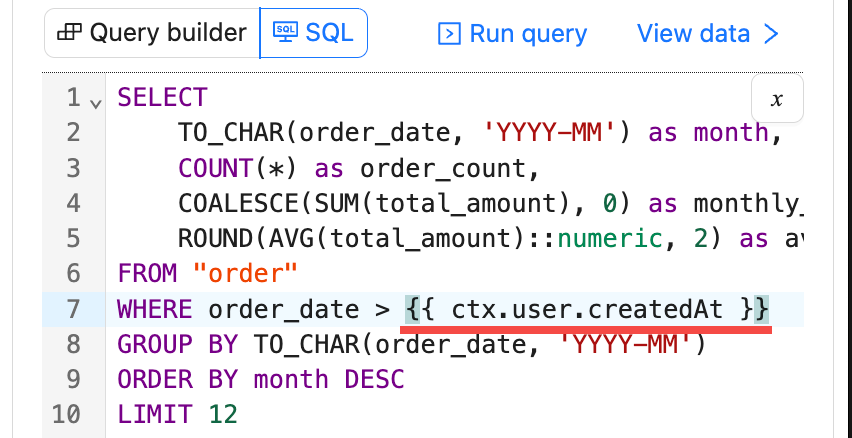
Example: order amount by month
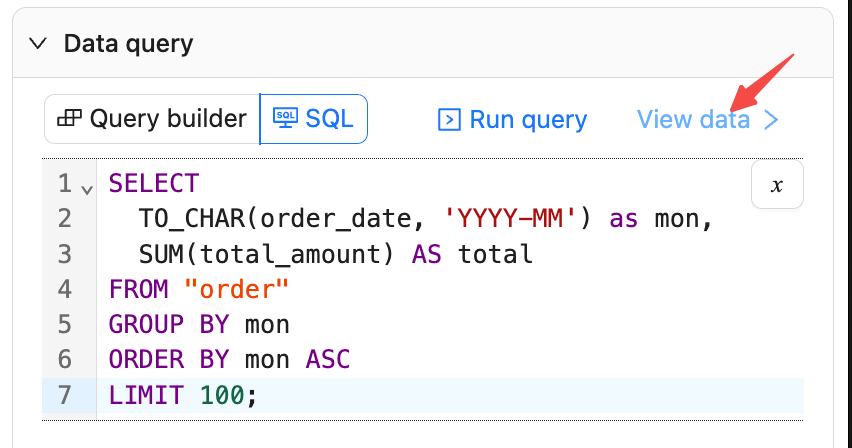
View results
- Click View data to open the preview panel.
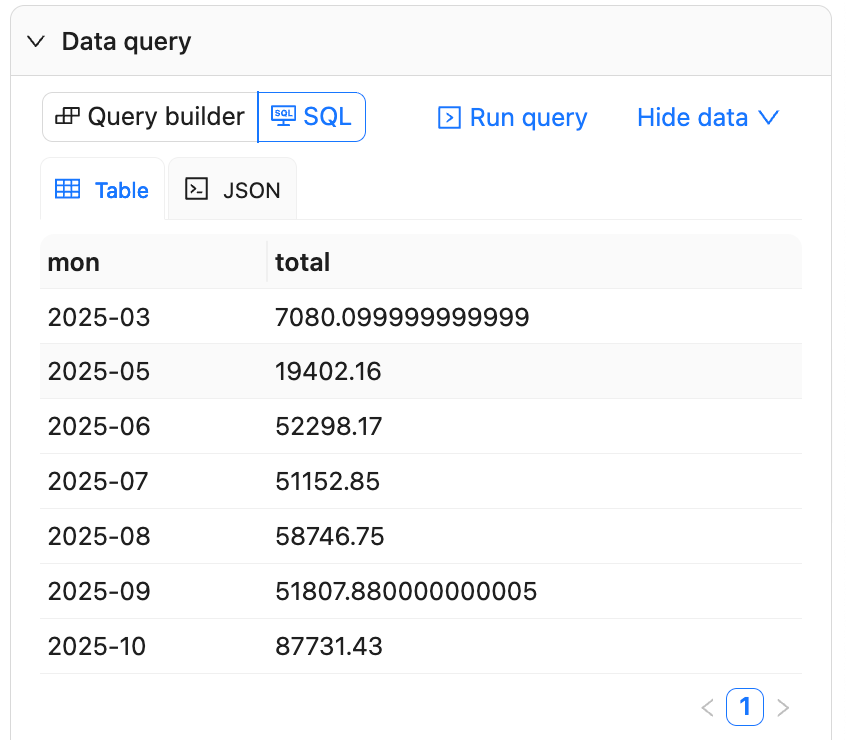
Data supports pagination; you can switch between Table and JSON to check column names and types.
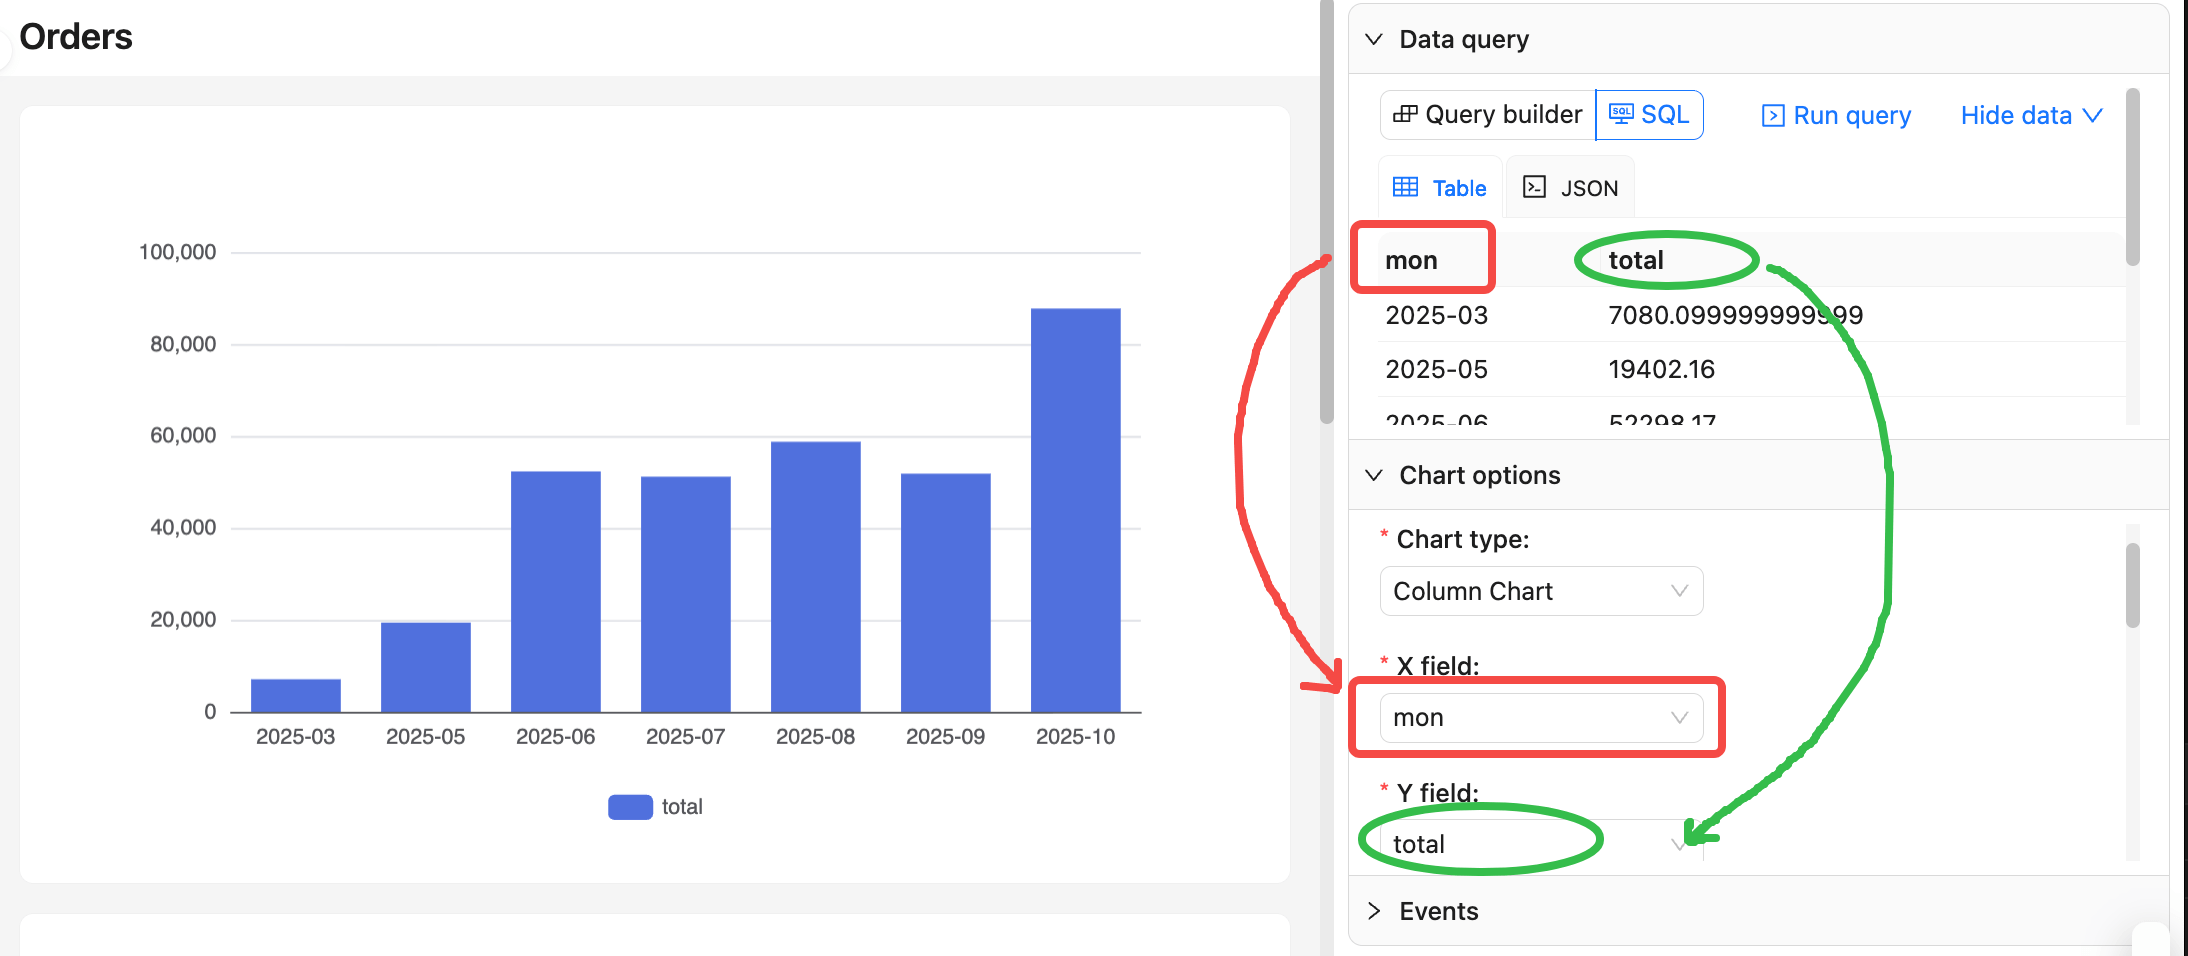
Field mapping
- In Chart options, map fields based on the query result columns.
- By default, the first column is used as the dimension (X axis or category), and the second column as the measure (Y axis or value). Mind the column order in SQL:
Use context variables
Click the x button at the top‑right of the SQL editor to choose context variables.
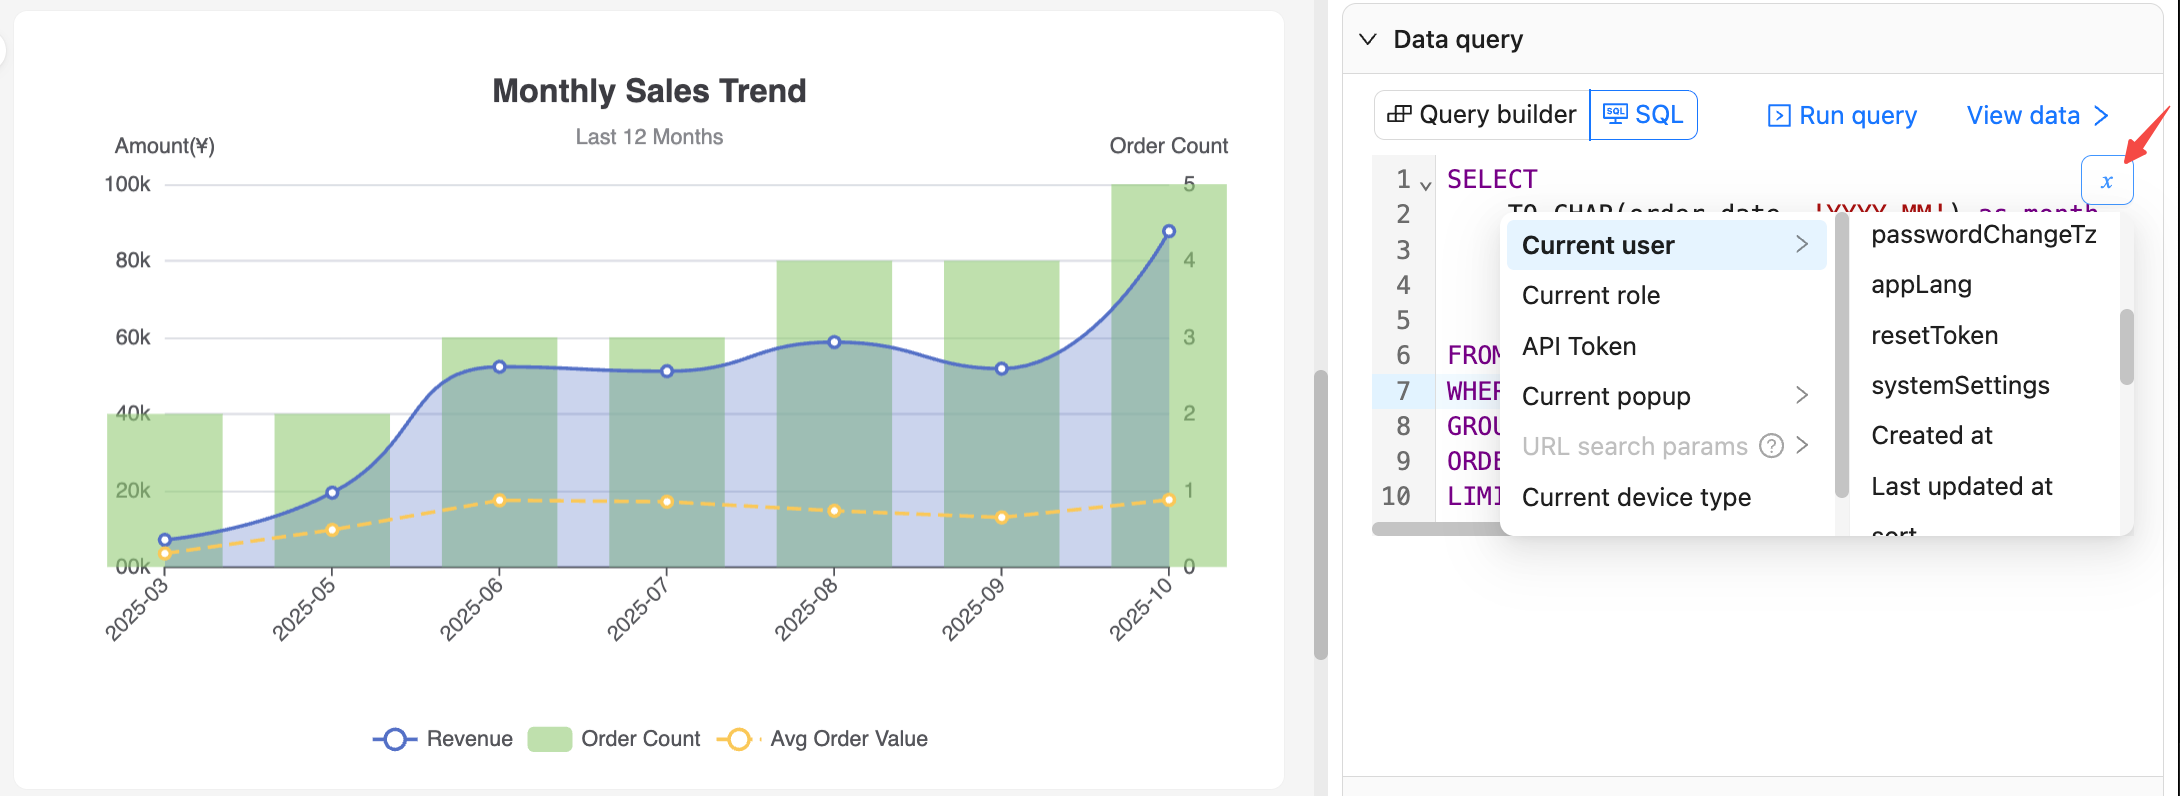
After confirming, the variable expression is inserted at the cursor (or replaces the selected text).
For example, {{ ctx.user.createdAt }}. Do not add extra quotes.
More examples
For more examples, see the NocoBase Demo app
Recommendations:
- Stabilize column names before mapping to charts to avoid errors later.
- During debugging, set
LIMITto reduce returned rows and speed up preview.
Preview, save, and rollback
- Click Run query to request data and refresh the chart preview.
- Click Save to persist the current SQL text and related configuration to the database.
- Click Cancel to revert to the last saved state and discard current unsaved changes.