

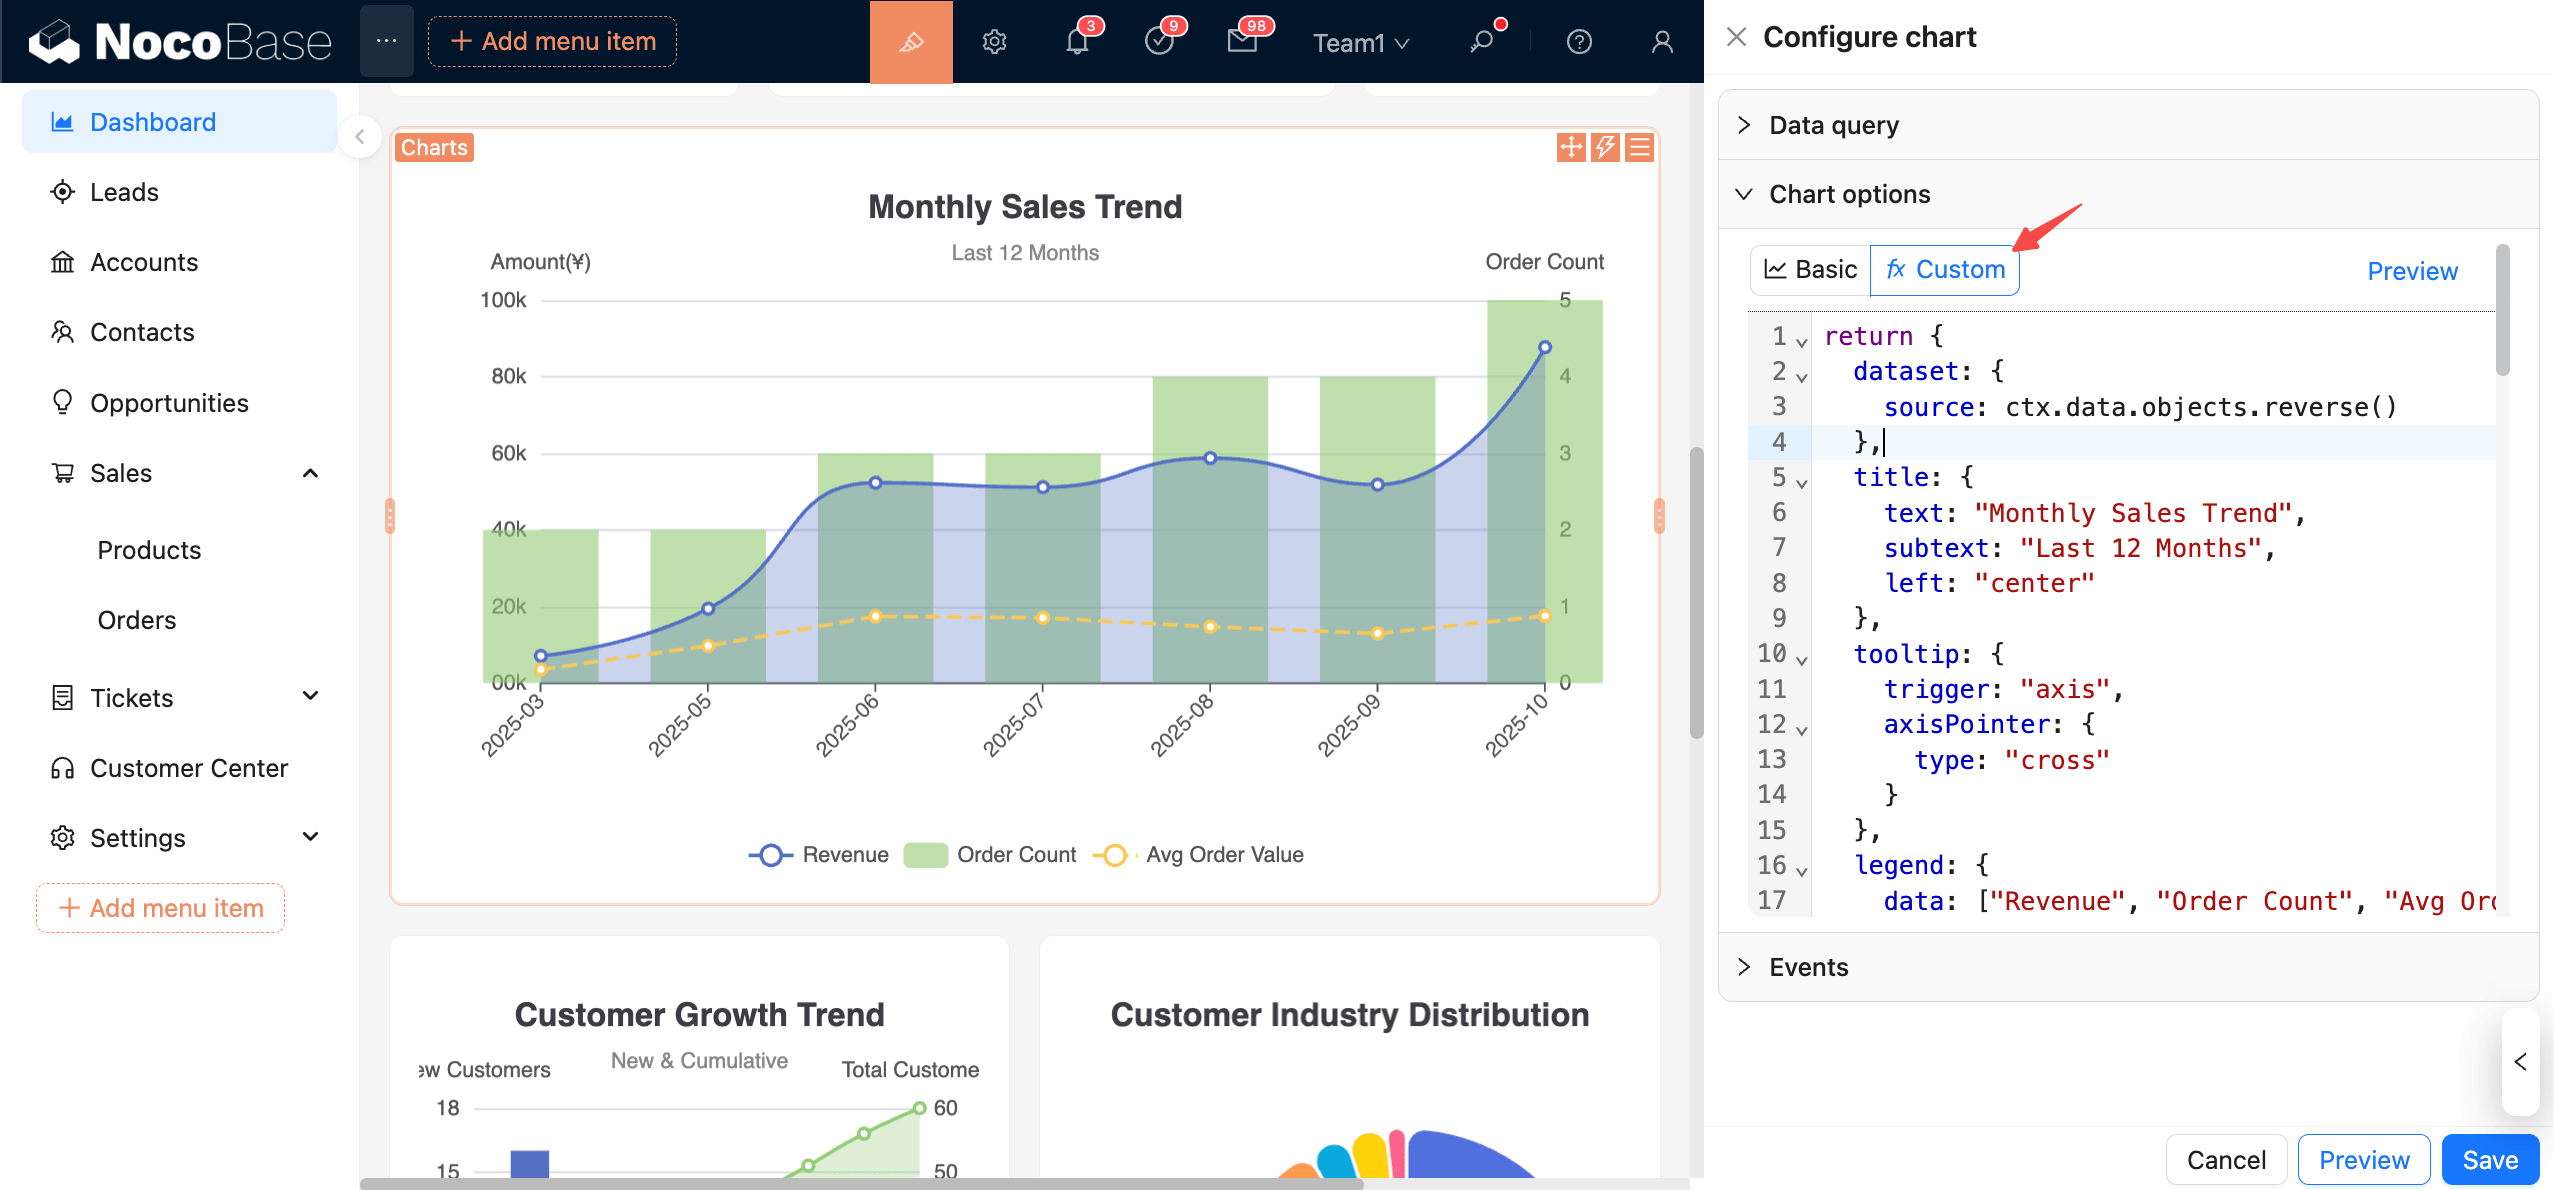
自定义图表配置
自定义模式配置图表,可以在代码编辑器编写 JS,基于 ctx.data 返回完整的 ECharts option,适合多系列合并、复杂提示与动态样式。理论上可以支持完整的 Echart 功能和所有的图表类型。
数据上下文
ctx.data.objects:对象数组(每行记录)ctx.data.rows:二维数组(含表头)ctx.data.columns:按列分组的二维数组
推荐用法:
把数据统一收敛在 dataset.resource 中,详细用法请参考 Echars 文档
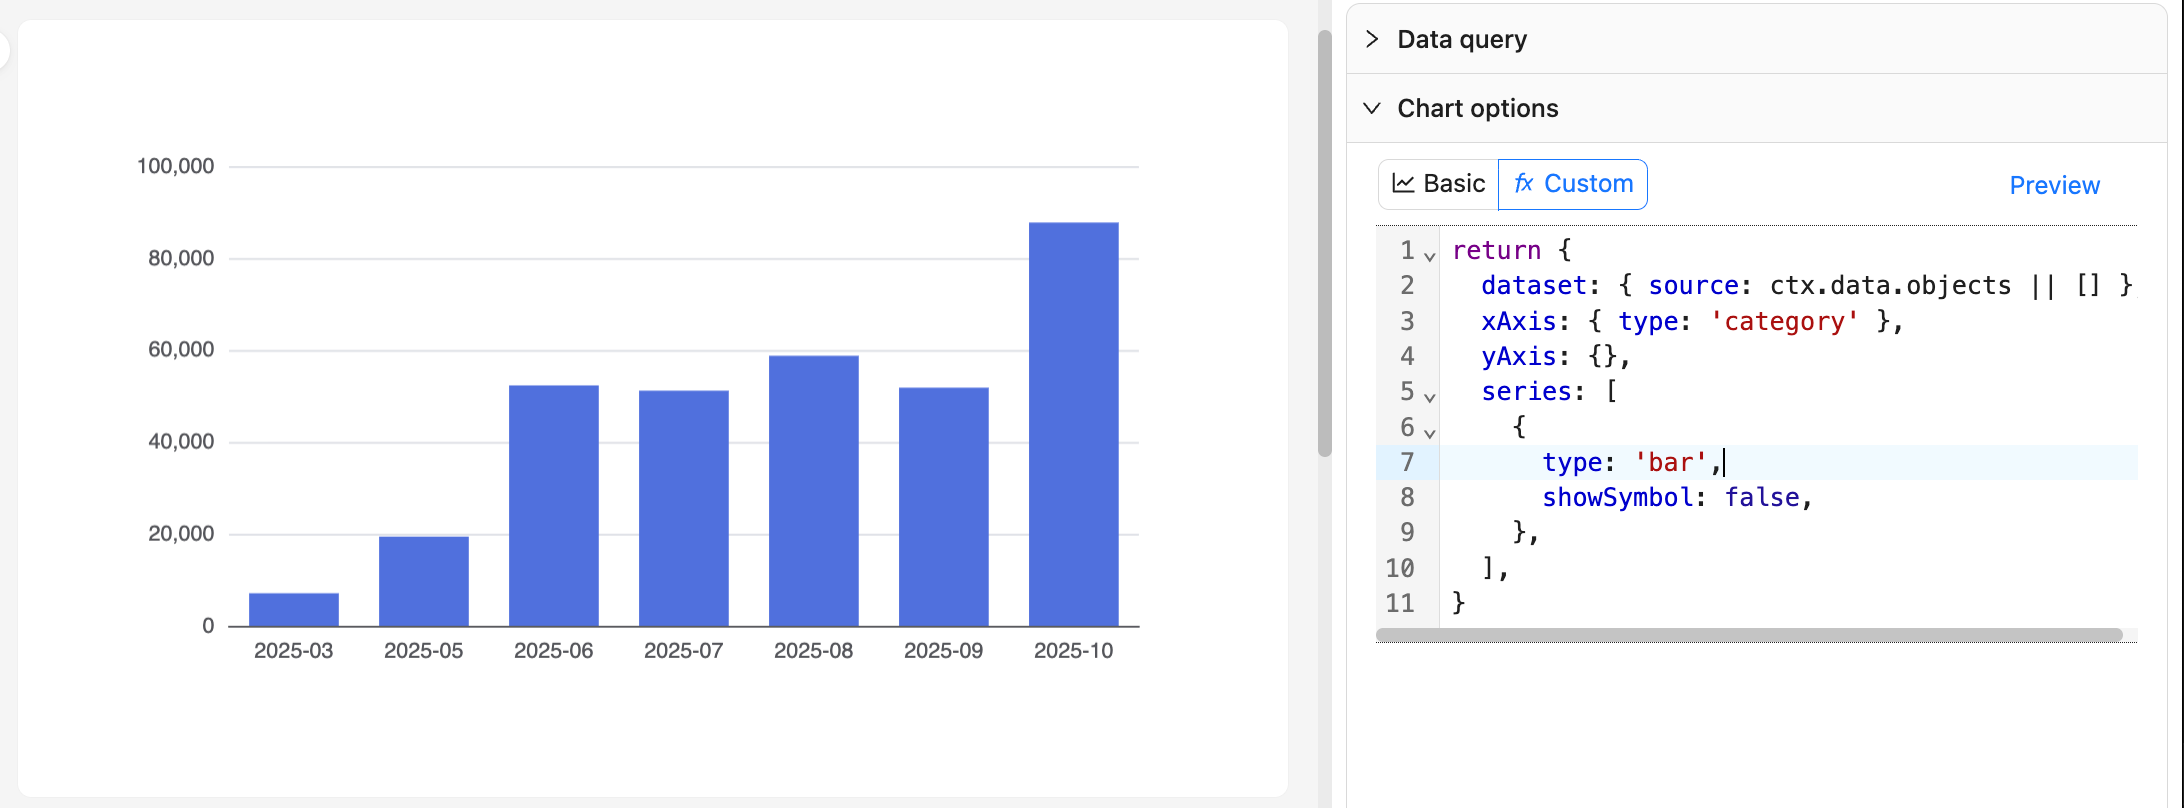
先来看一个最简单的例子:
示例一:按月订单量柱状图
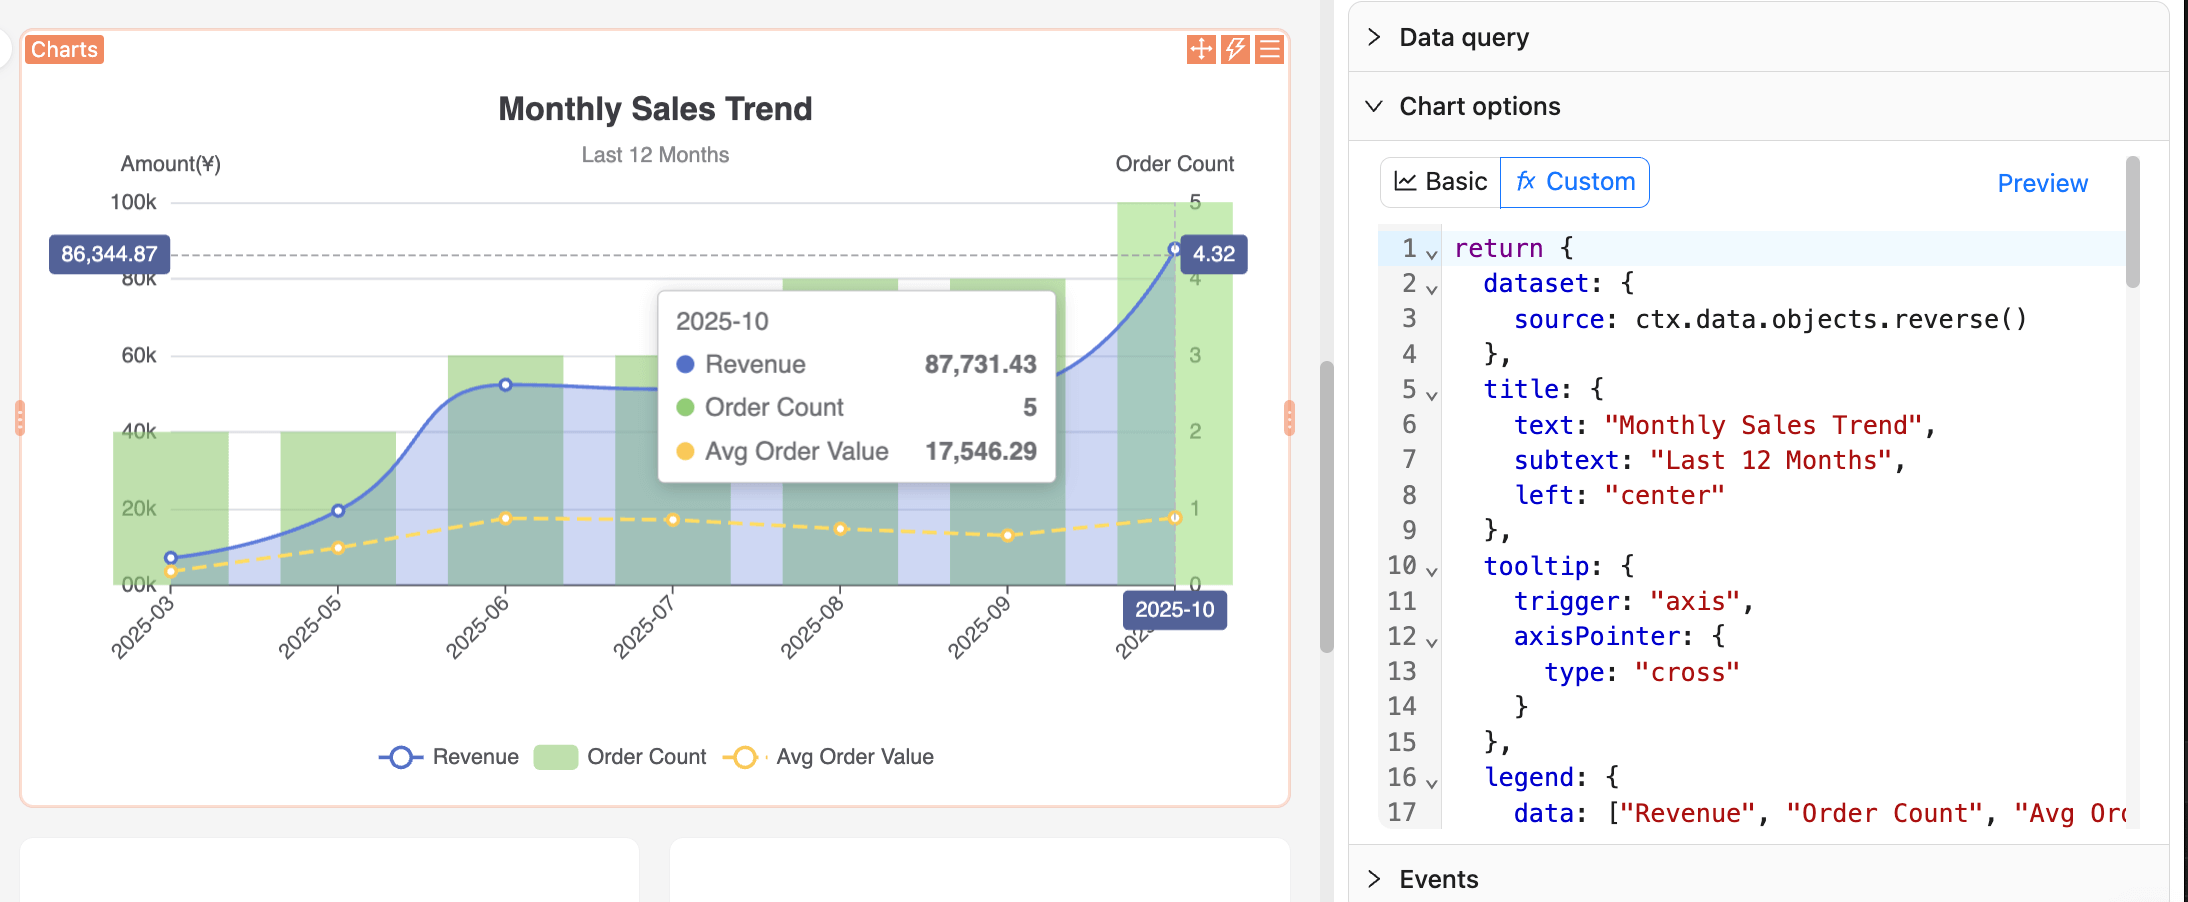
示例二:阅读销售趋势图
建议:
- 保持纯函数风格,仅根据
ctx.data生成option,避免副作用。 - 查询列名调整会影响索引,统一命名并在“查看数据”确认再修改代码。
- 数据量大时避免在 JS 中做复杂同步计算,必要时在查询阶段聚合。
更多示例
更多使用示例,可以参考 Nocobase Demo应用
也可以查看 Echarts 的官方 示例 从中选择你想要的图表效果,参考和复制 JS 配置代码。
预览与保存
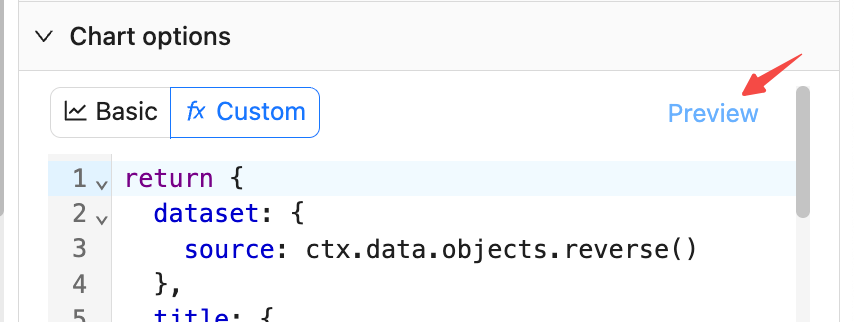
- 点击右侧“预览”,或底部“预览”,刷新图表以验证 JS 配置内容。
- 点击“保存”会将当前 JS 配置内容保存到数据库。
- 点击“取消”则回退到上次保存状态。