
In Quality › Metrics, choose a test type and time range to inspect results and trends. The overview also shows recent dimension results.
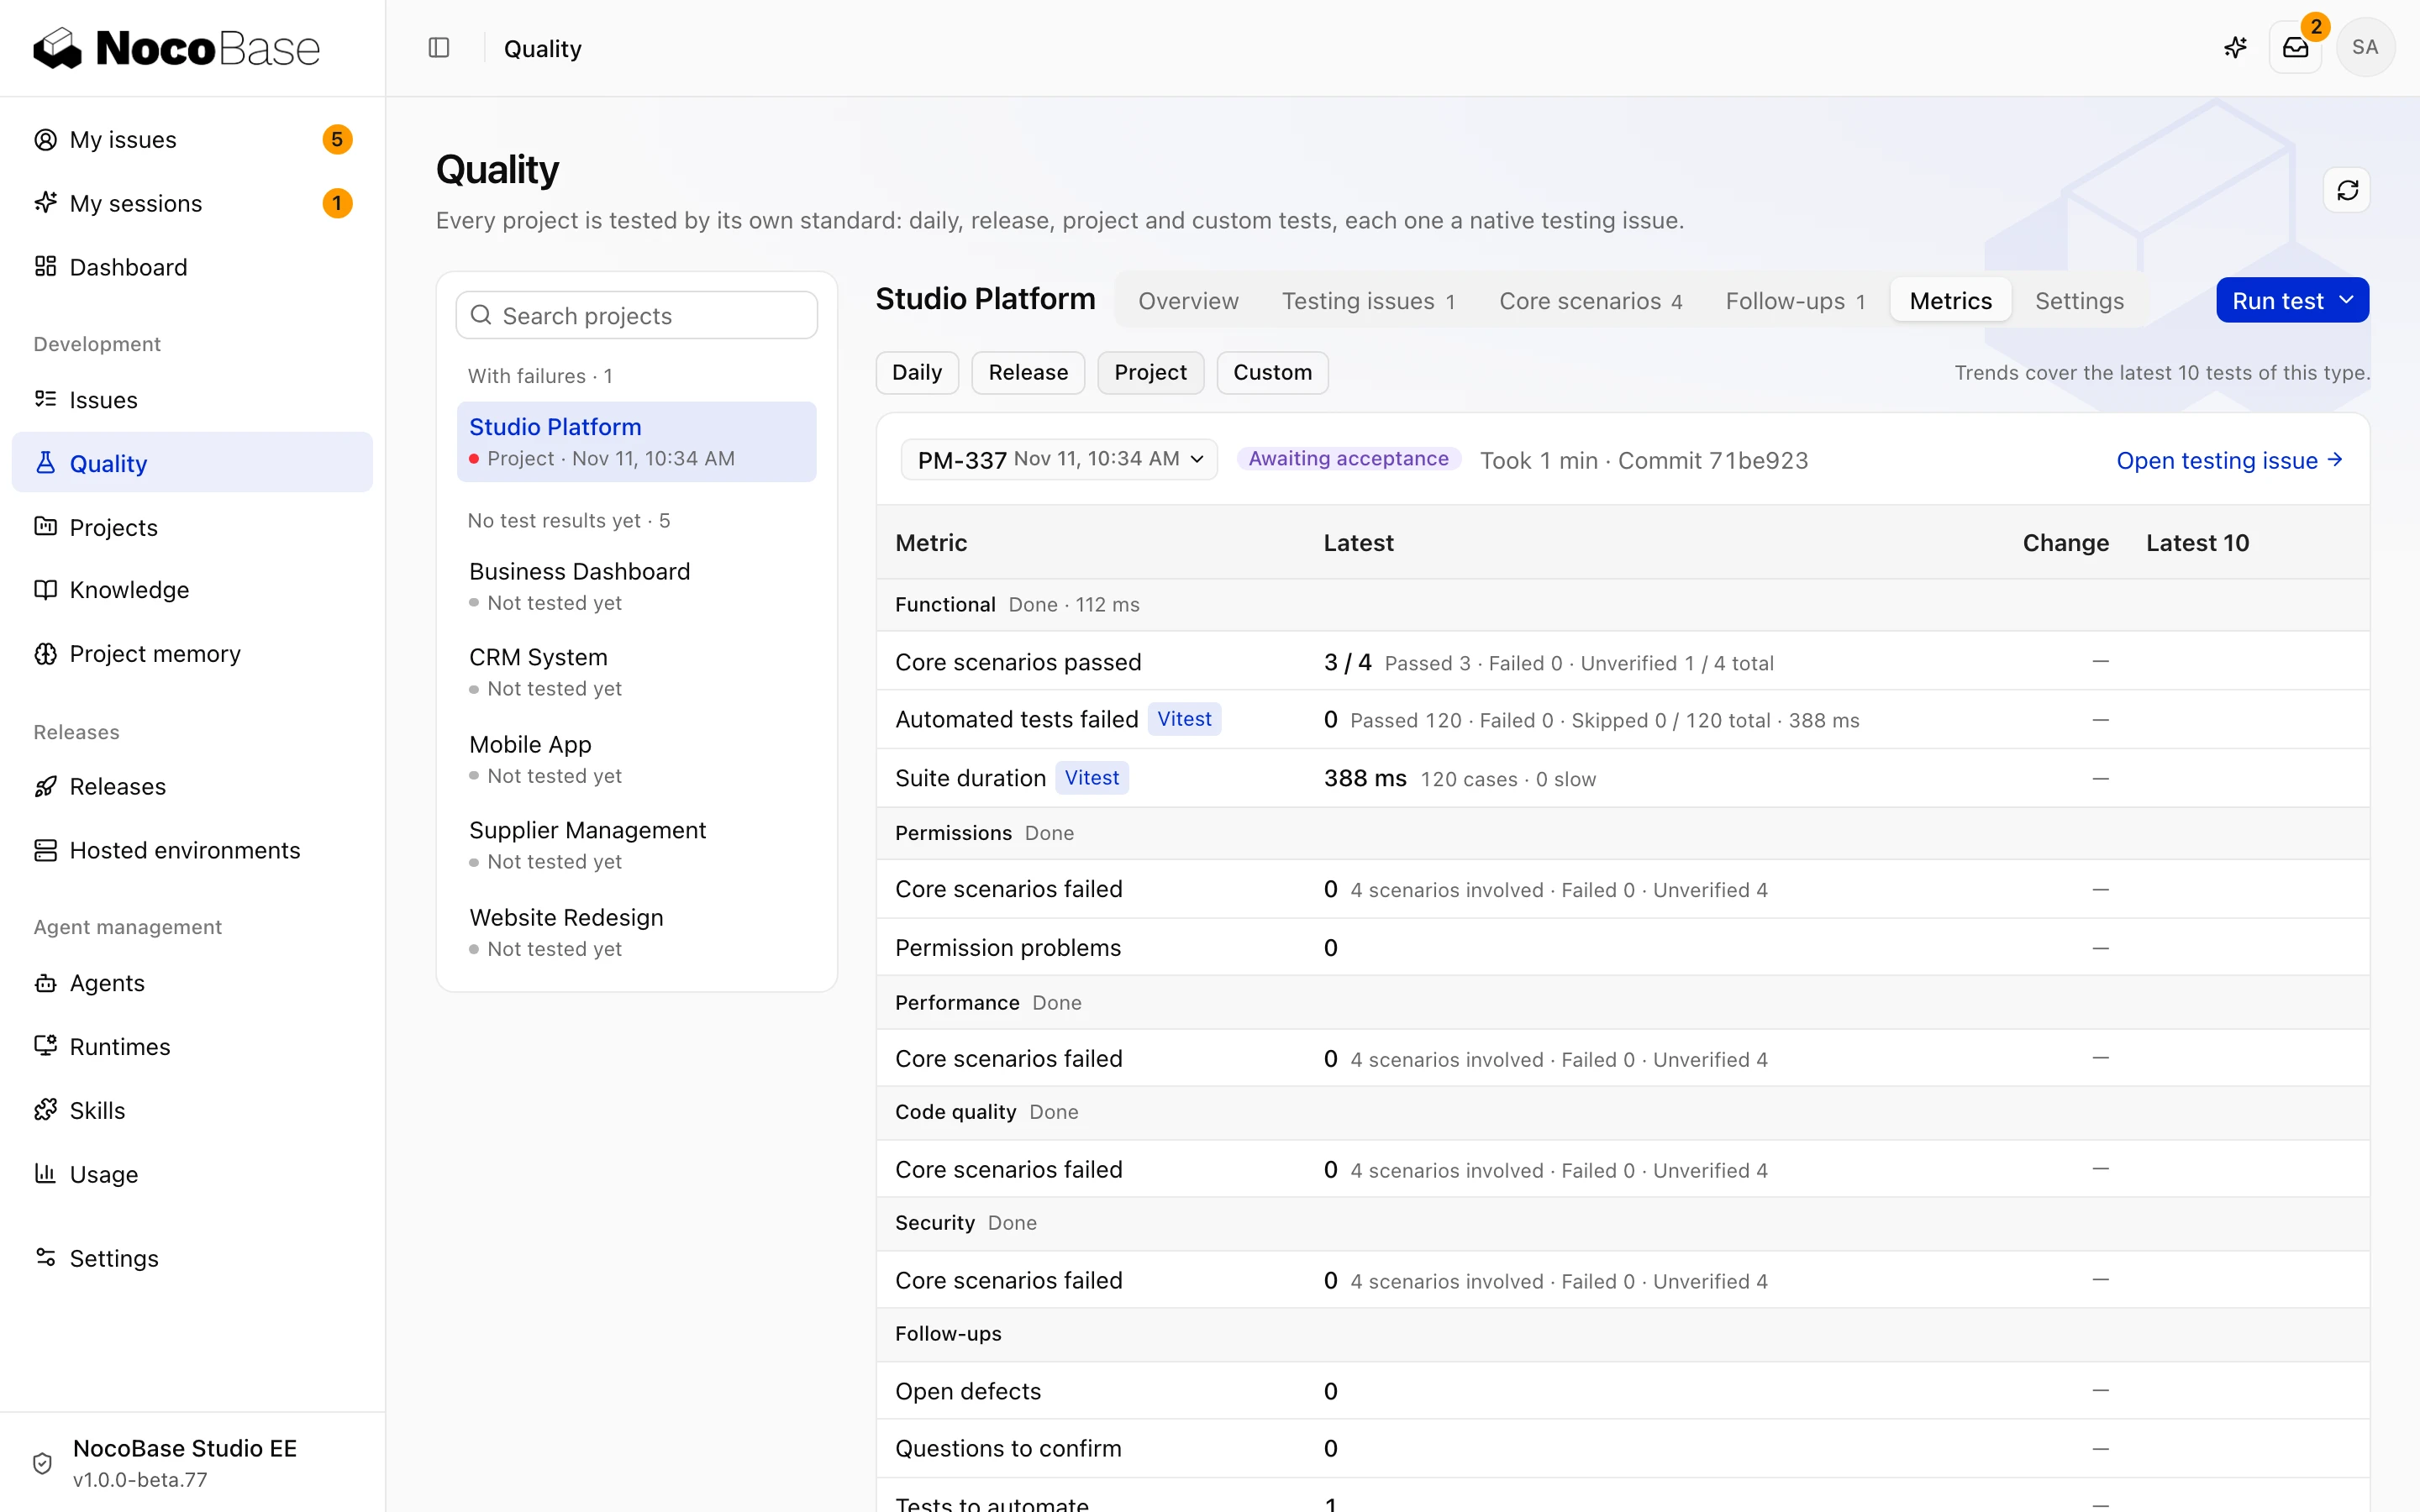
Metric definitions
| Data | Source |
|---|---|
| Task, scenario, and checkpoint outcomes | Explicit findings and evidence submitted by each dimension |
| Automated passes, failures, skips, and duration | Uploaded reports from Vitest, Playwright, and other test runners |
| Dependency vulnerabilities | Dependency audit output, separated into production and development dependencies |
| Page and API performance | Compare measurements for the same page or endpoint |
| Permission checks | Compare expected and observed access by role and action. Check which cases lack evidence |
| Scan findings | Inspect results submitted in SARIF format and the affected locations |
| Code quality | Findings and locations recorded in the code quality report |
| Follow-up tasks | Linked defects, questions, test cases, scenarios, and cleanup tasks |
Missing reports produce no corresponding metrics. An empty value does not mean zero problems. Unverified and not applicable do not mean passed.
Trends and details
Open a metric to inspect the related tests, scenarios, or findings. Before comparing results, check the type, scope, code commit, and selected dimensions.
Adding or removing scenarios changes totals. Stable scenario keys support comparisons across tests. More tests or fewer issues only become meaningful alongside scope changes. Use reports and evidence to understand the difference.