

Gantt Block
Block: GanttCommunity Edition+Introduction
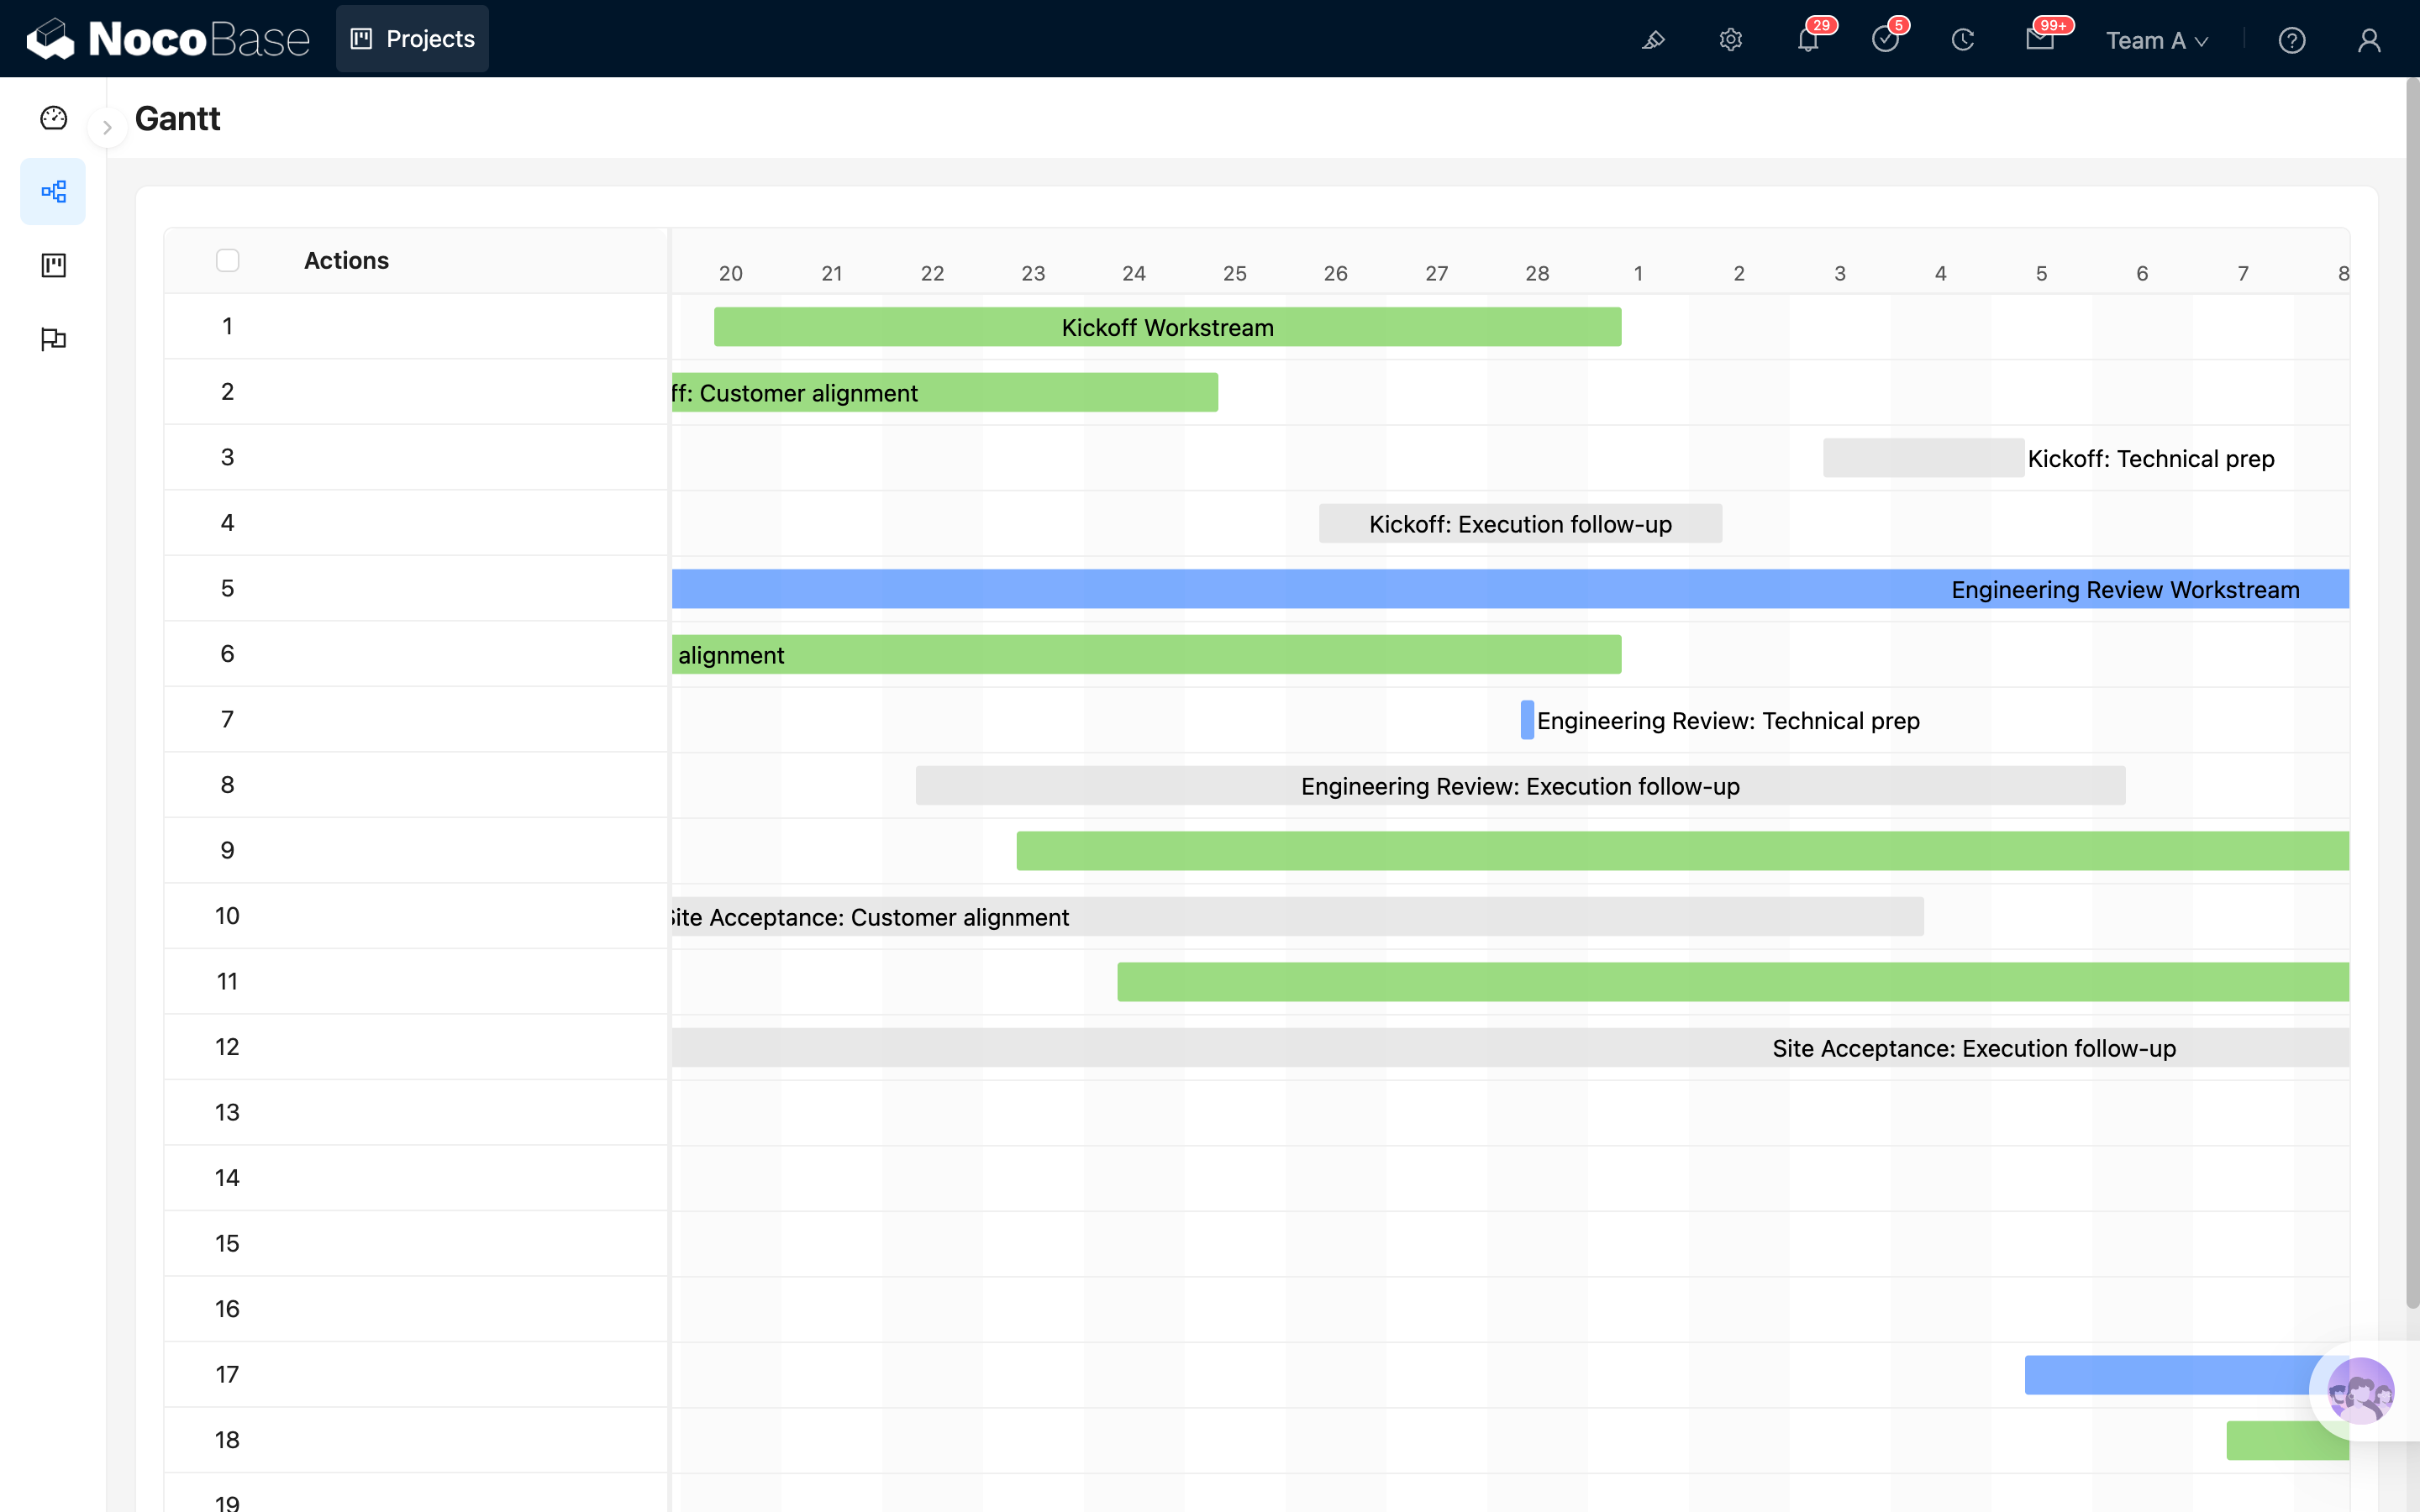
The Gantt block displays record start and end dates and progress on a timeline. It is suitable for project planning, task scheduling, milestone tracking, and other scenarios where you need to view task duration by time.
Installation
This block is a built-in plugin and does not require additional installation.
Add Block
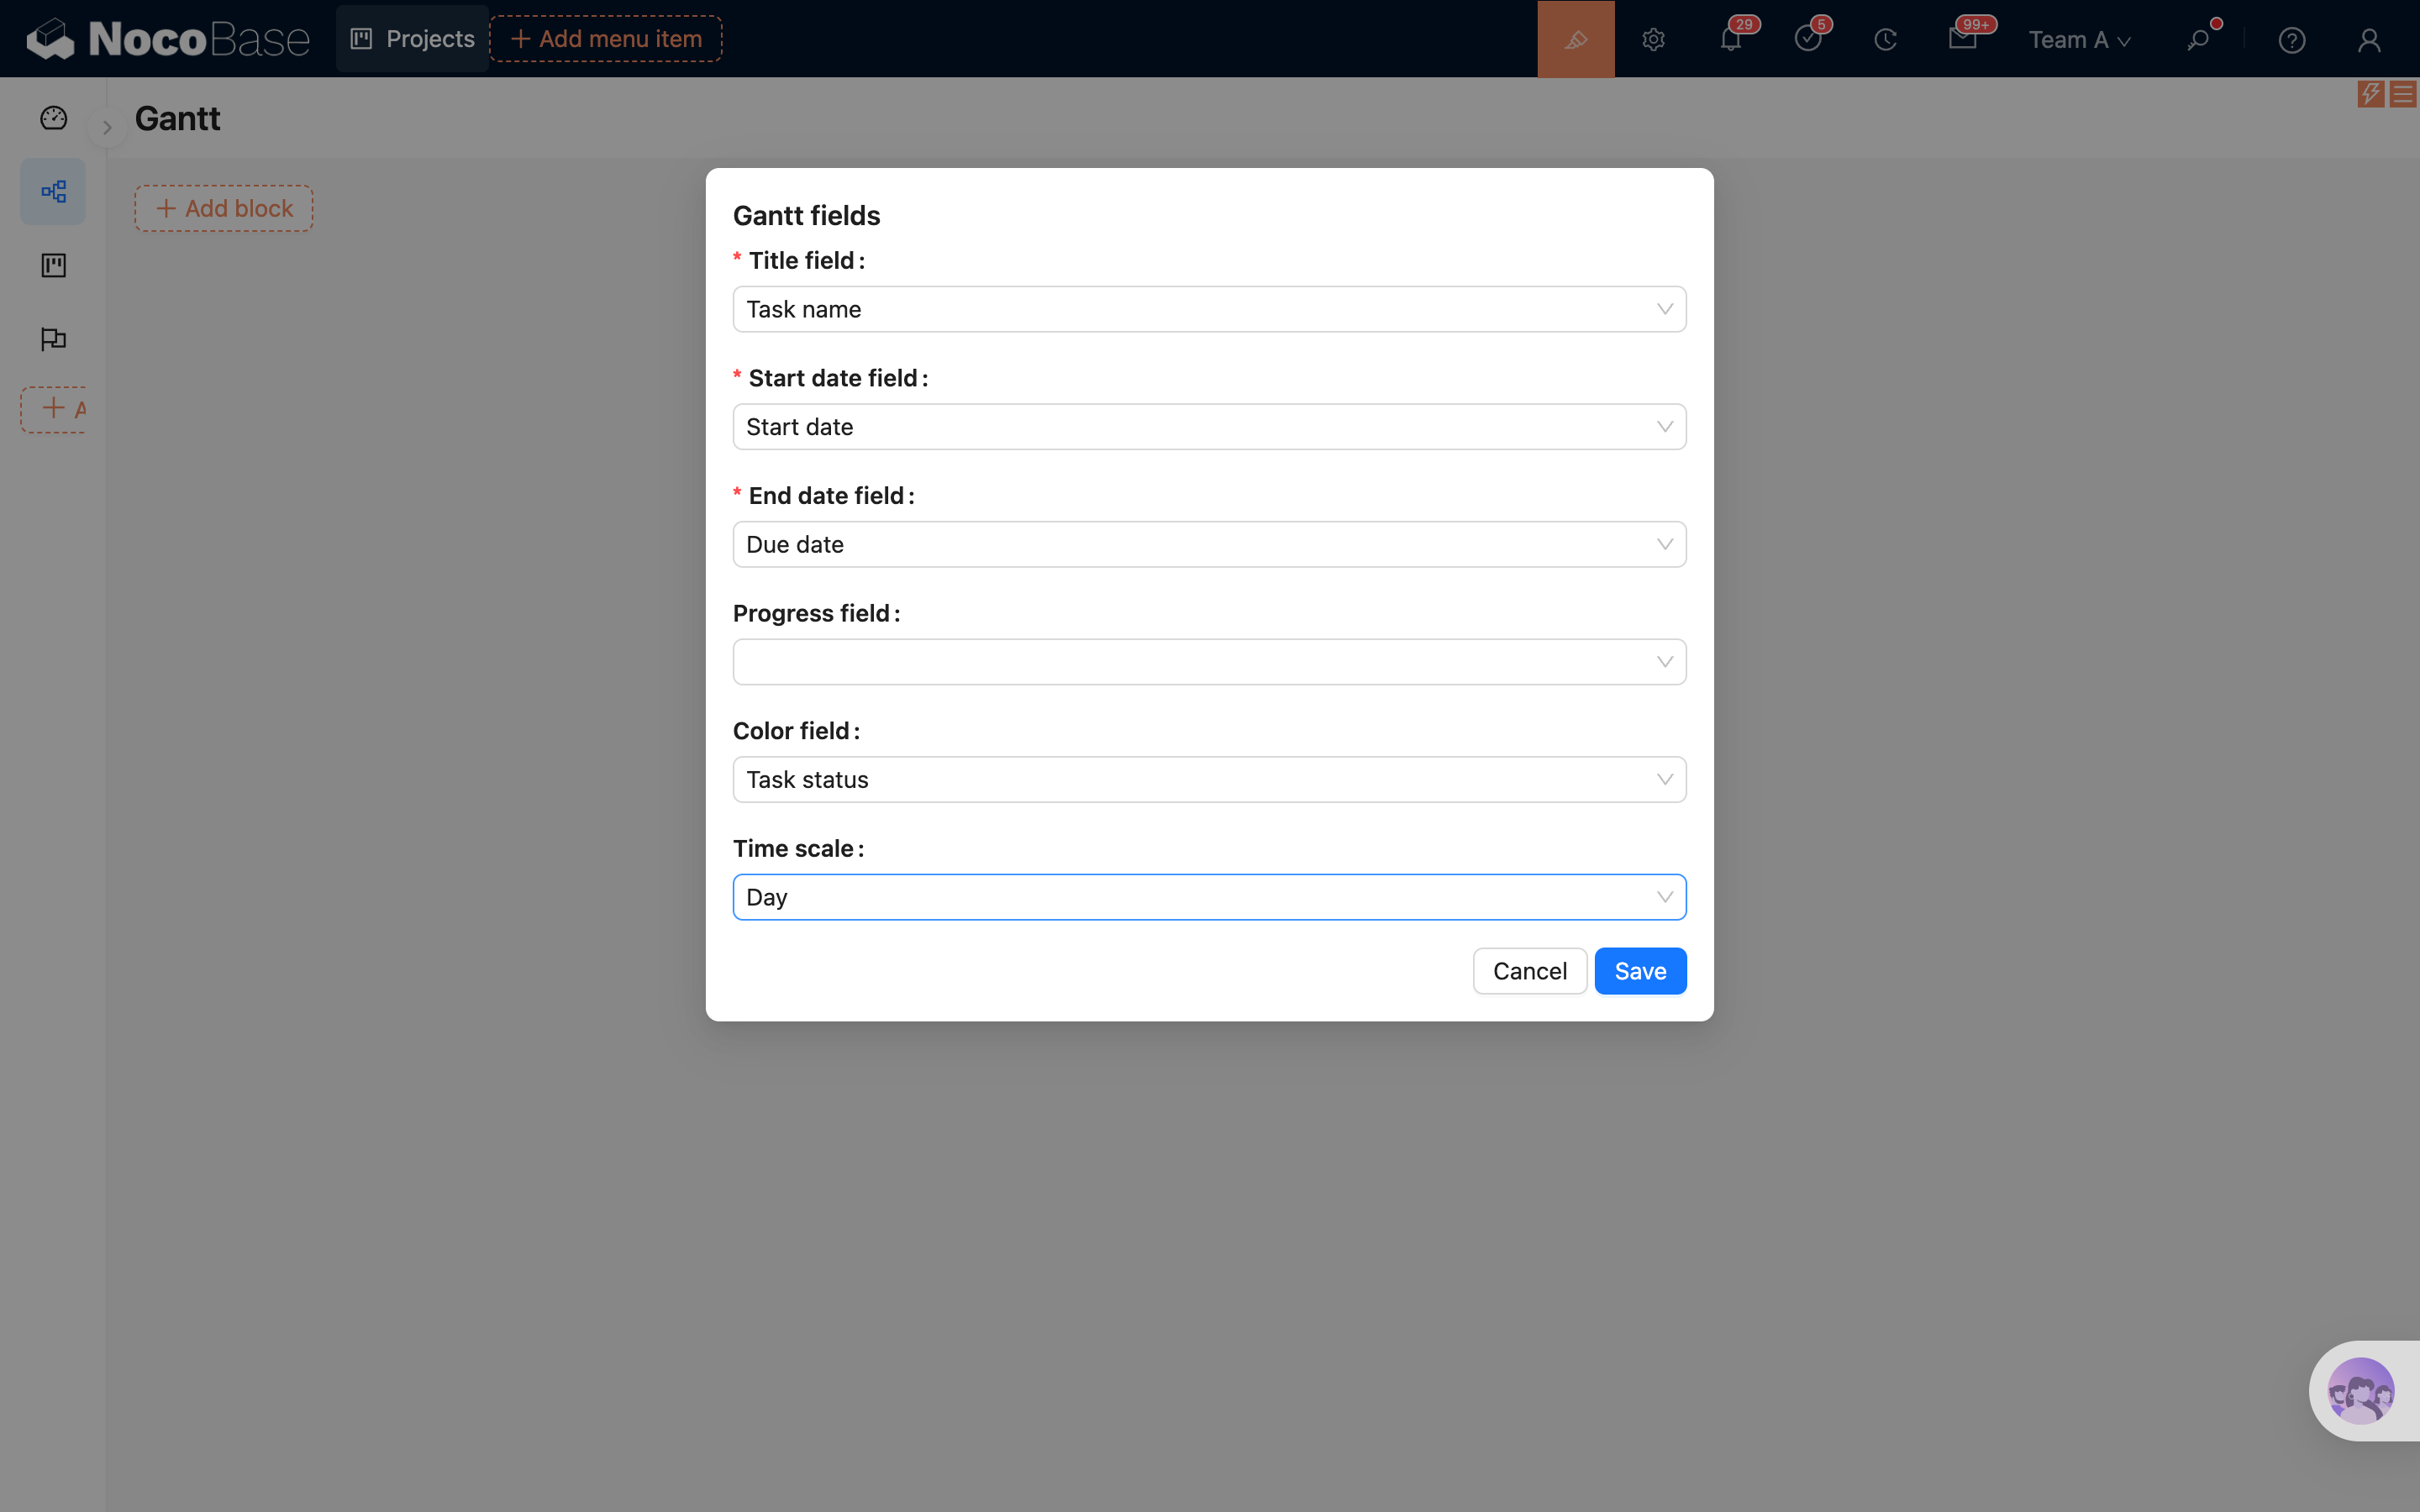
After selecting the Gantt block and choosing a data table, configure the fields required by the Gantt block in the popup:
- Select the title field, which is used to display the task name
- Select the start date field, which is used to determine the task start time
- Select the end date field, which is used to determine the task end time
- Optionally select the progress field, which is used to display and drag to update task progress
- Optionally select the color field, which is used to distinguish different tasks
- Select the time scale, which controls the granularity of the timeline
After completing the configuration, you can create the Gantt block.
.png)
Block Settings
Gantt Fields
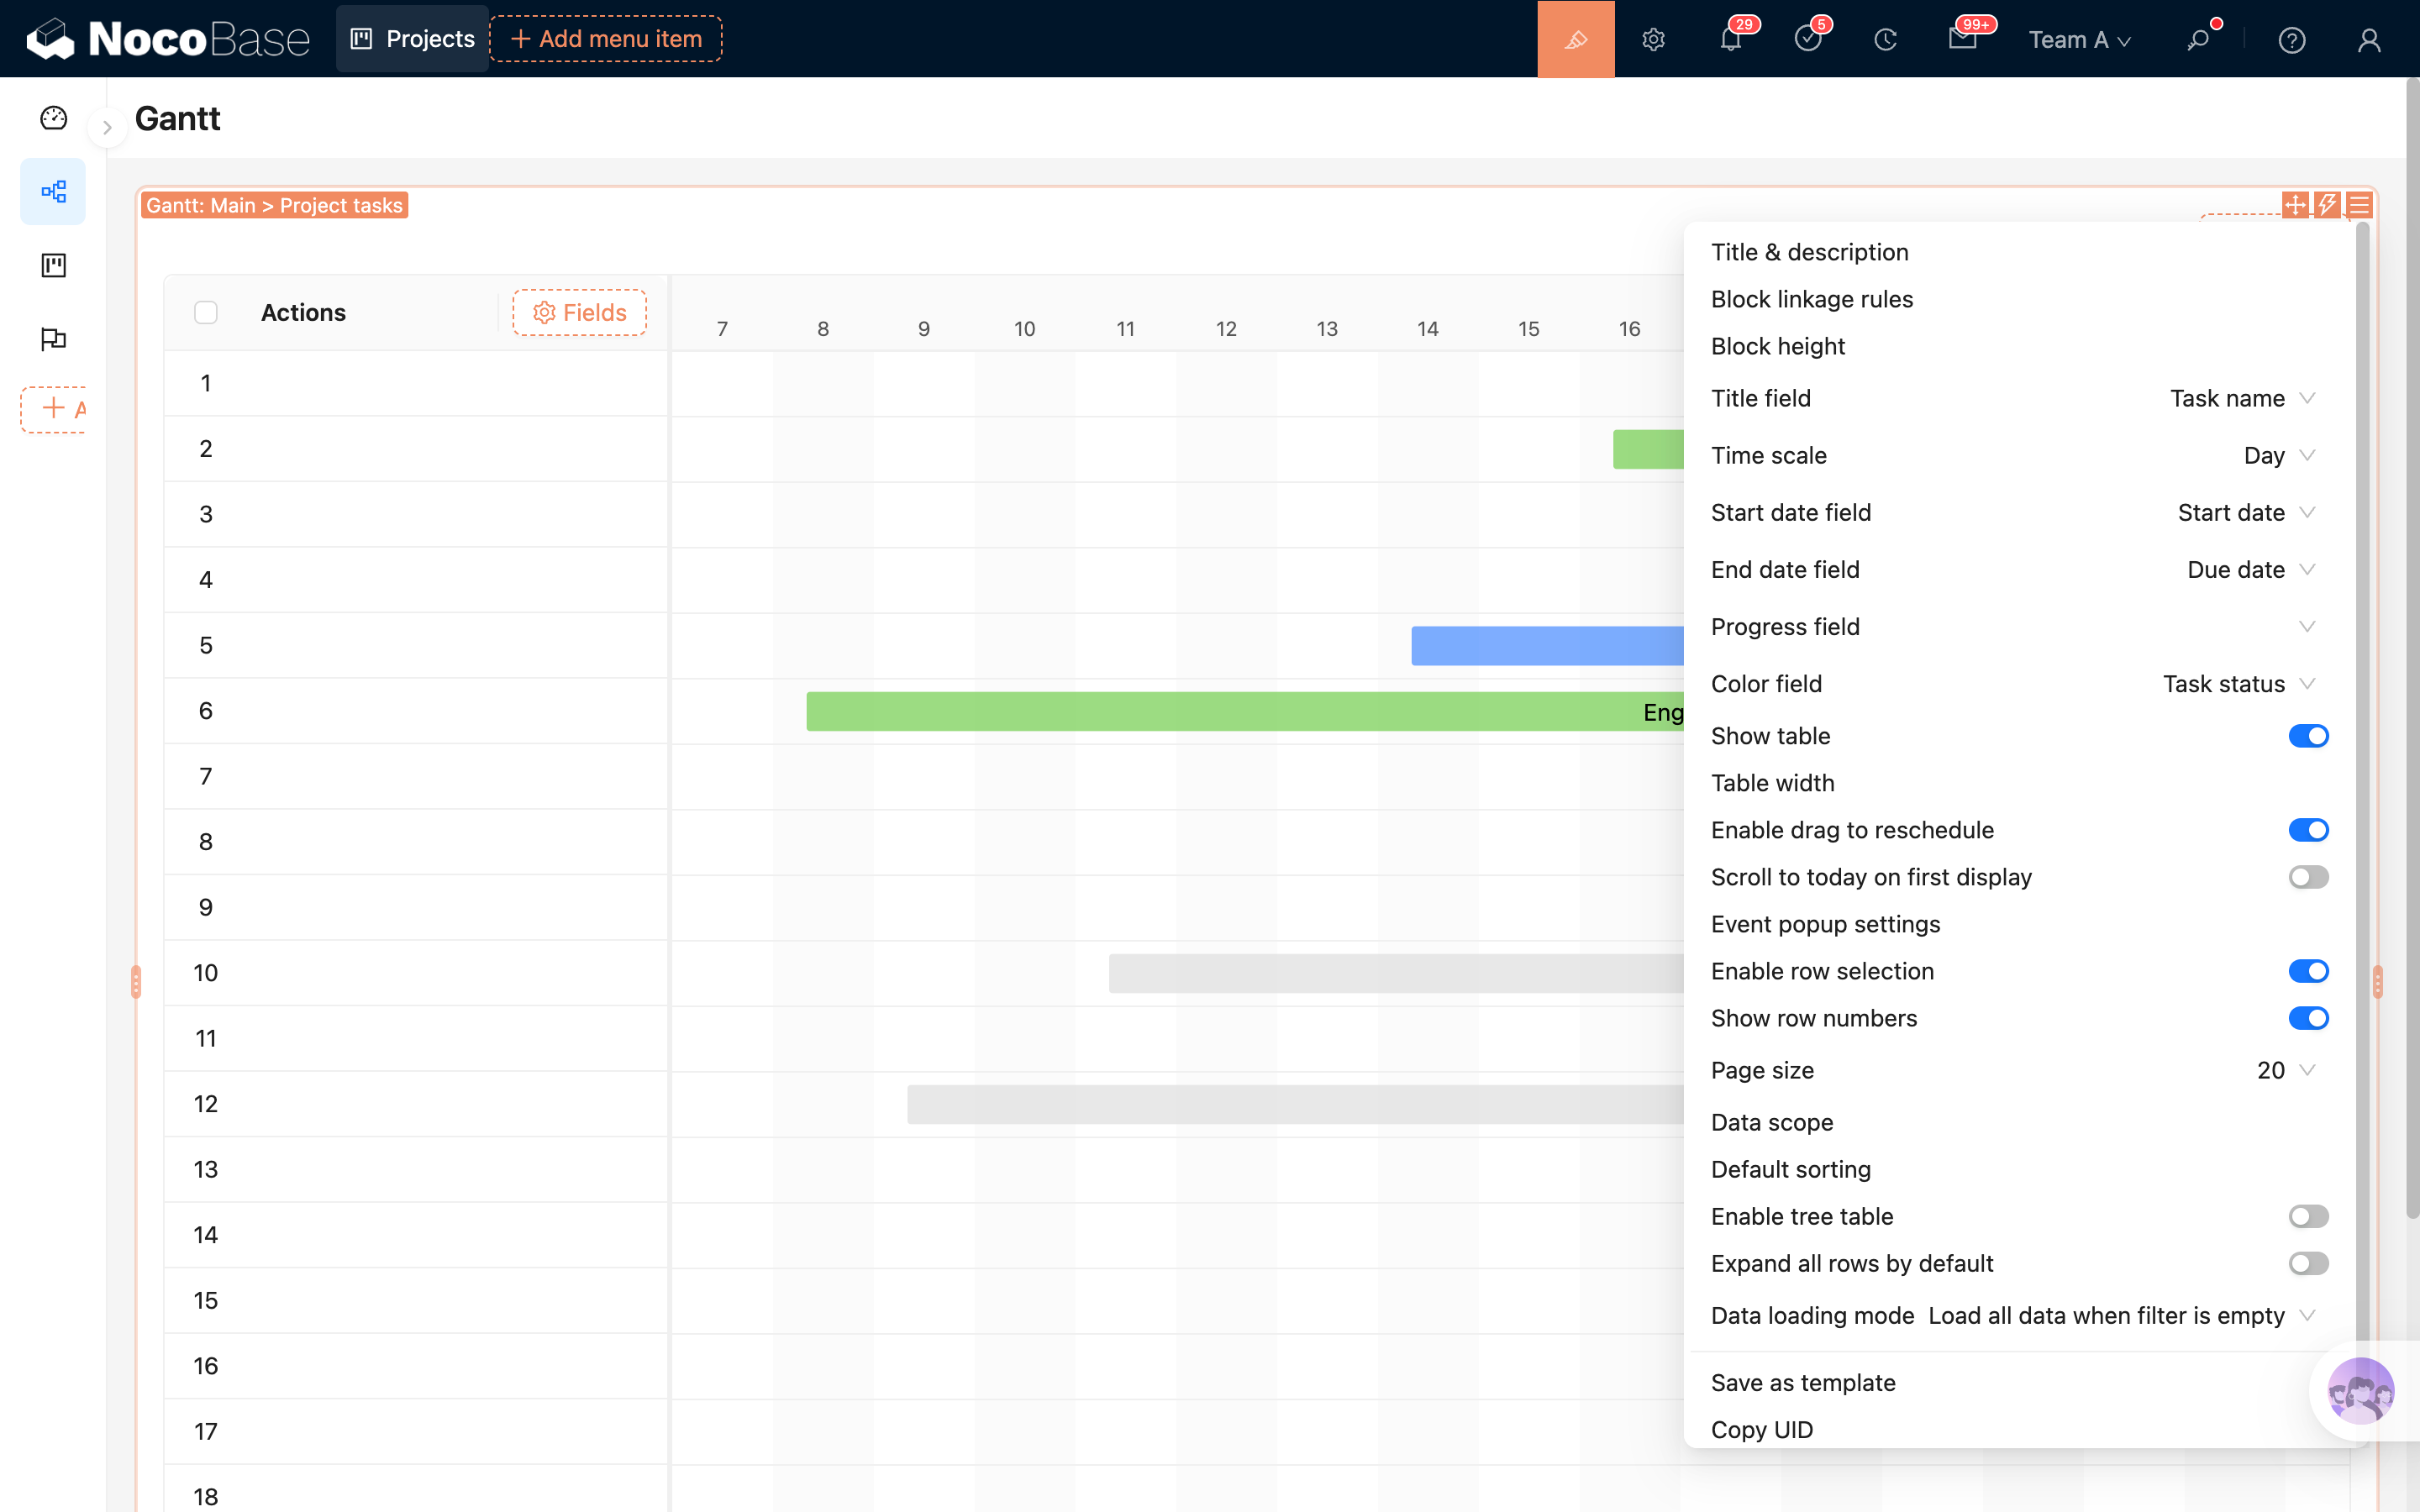
Gantt fields determine how records are mapped to timeline tasks.
They include:
- The title field determines the name displayed on the task bar
- The start date field determines where the task bar starts
- The end date field determines where the task bar ends
- The progress field determines the progress displayed inside the task bar
- The color field determines the task bar color
- The time scale determines whether the timeline is displayed by hour, day, week, month, and so on
Title Field
Used to display the task name. Usually, you can select a string field such as task name, project name, or title.
Start Date Field
Used to specify the task start time. The Gantt block uses this field to place the task on the timeline.
End Date Field
Used to specify the task end time. When the start date and end date are the same, the task is displayed as a shorter time range.
Progress Field
Used to display task completion progress, and supports updating it by dragging the progress handle on the task bar.
The progress field uses a float field. Data is stored from 0 to 1, and displayed as a percentage in the Gantt block. For example, 0.6 is displayed as 60%.
Color Field
Used to set the task bar color, making it easier to distinguish different task types, statuses, or priorities.
The color field supports:
- Single select field
- Color field
If a single select field is used, the Gantt block will prioritize the color configured for the selected option.
Time Scale
Used to control the timeline display granularity.
Currently supported:
- Hour
- Quarter of day
- Half of day
- Day
- Week
- Month
- Year
- Quarter
For short task spans, use hour, half-day, or day. For longer task spans, use week, month, quarter, or year.
Show Table
When enabled, the Gantt block displays a table area on the left. You can configure table columns to show key task attributes.
When disabled, the block only displays the timeline on the right. This is suitable when page space is limited or you only need to view scheduling.
Table Width
Used to set the width of the left table area. This setting only appears when Show table is enabled.
If there are many table fields, increase the table width. If only a few fields are kept, reduce the width and leave more space for the timeline.
Enable Drag to Reschedule
When enabled, you can drag task bars on the timeline to adjust start and end dates.
Details:
- Drag the whole task bar to adjust both the start date and end date
- Drag the handles on both sides of the task bar to adjust the start date or end date
- Drag the progress handle to update the progress field
If you do not want users to modify schedules directly in the Gantt block, disable this option.
Scroll to Today on First Display
When enabled, the Gantt block automatically scrolls to today when it is first displayed.
This option is suitable for projects with long task spans. When the page opens, users can first see tasks near the current date.
Event Popup Settings
Used to configure how a task bar opens after being clicked.
You can configure:
- Open mode, such as drawer, dialog, or page
- Popup size
- Popup template
After clicking a task bar, NocoBase opens the current record according to this configuration, making it convenient to view or edit task details.
Data Scope
Used to limit the data displayed in the Gantt block.
For example: only show tasks under the current project, or only show unfinished tasks.
For more details, refer to Data Scope.
Page Size
Used to control the number of records loaded per page. When there are many records, users can switch pages to view more tasks.
Show Row Numbers
When enabled, the left table displays row numbers, making it easier to locate records when there are many tasks.
Tree Table
If the current data table is a tree table, the Gantt block can enable tree table mode. After enabling it, the left table displays records by parent-child hierarchy, and the timeline on the right displays tasks in the same hierarchy.
In tree table mode, you can also configure Expand all rows by default.
Configure Fields
The left table area uses table columns to display record fields.
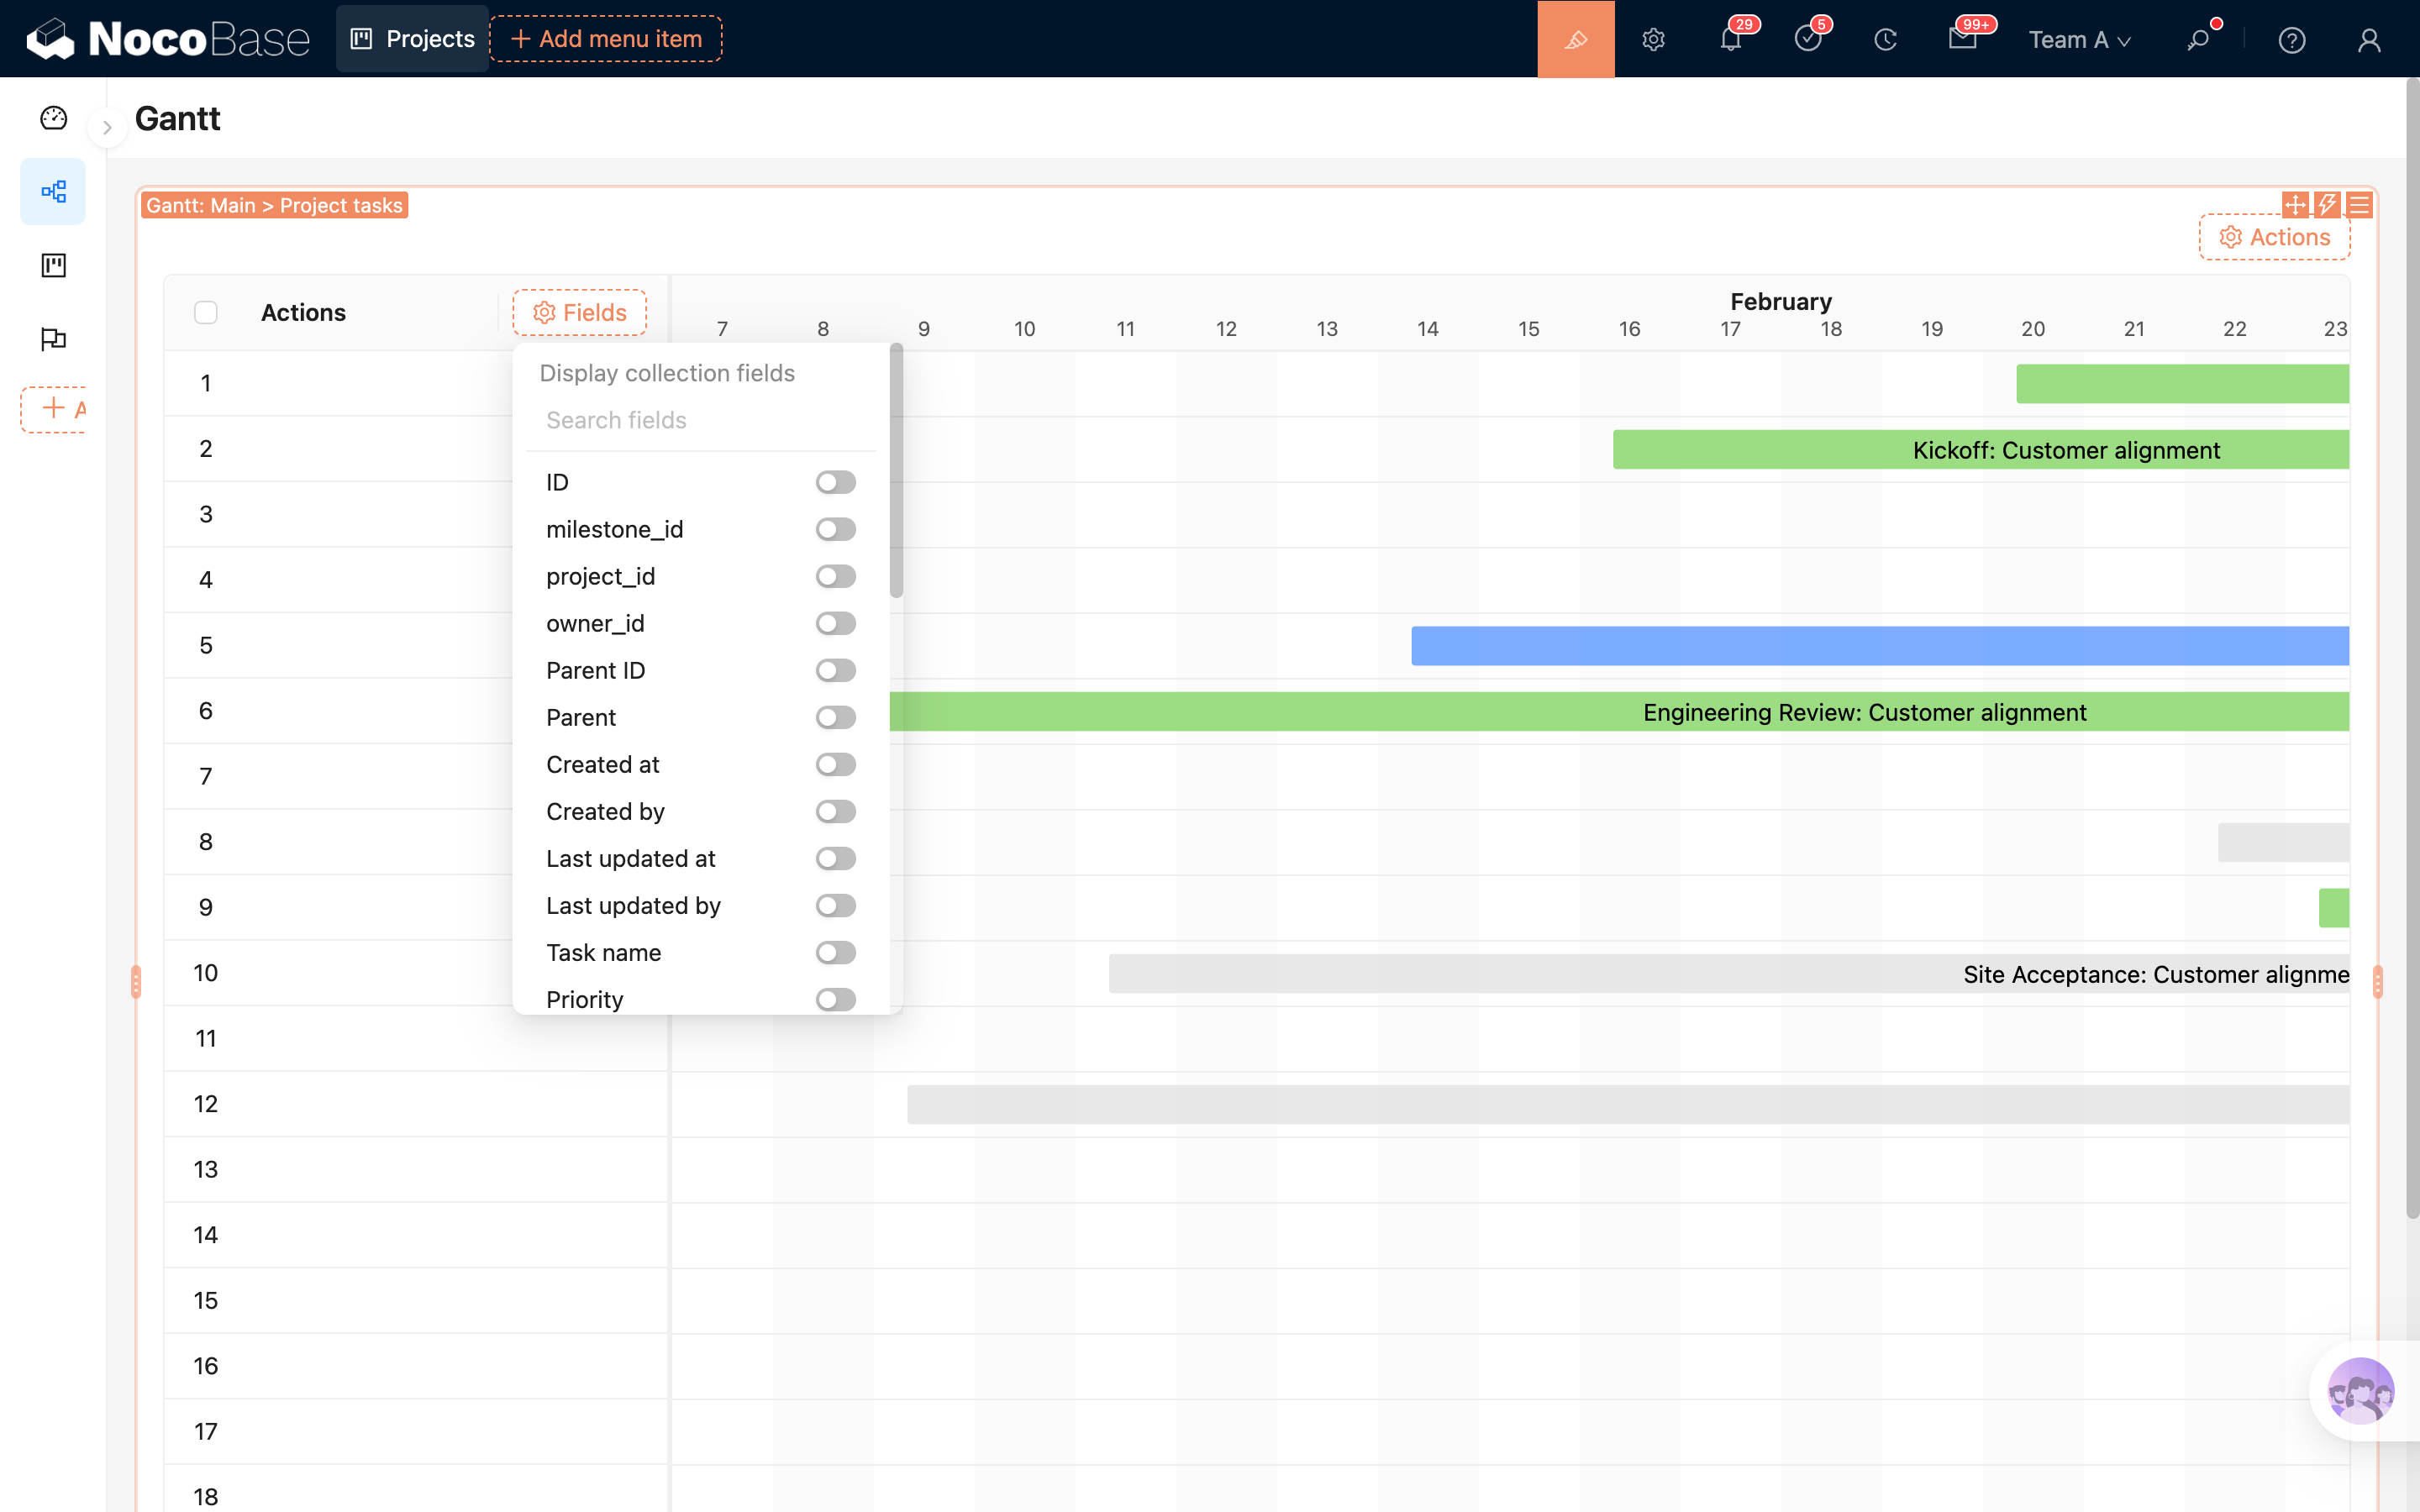
Add Fields
After Show table is enabled, you can add field columns to the left table. Field settings can refer to Table Column.
Actions Column
The Gantt block includes an actions column by default. You can add record actions such as view, edit, and delete to the actions column.
If Event popup settings have already been configured, you can also click the task bar on the right to open record details.
Configure Actions
The Gantt block supports configuring global actions at the top. Available action types depend on the enabled capabilities in the current environment.
.png)
Built-in Actions
- Today: quickly scroll to today
- Expand/Collapse: expand or collapse all rows in tree table mode